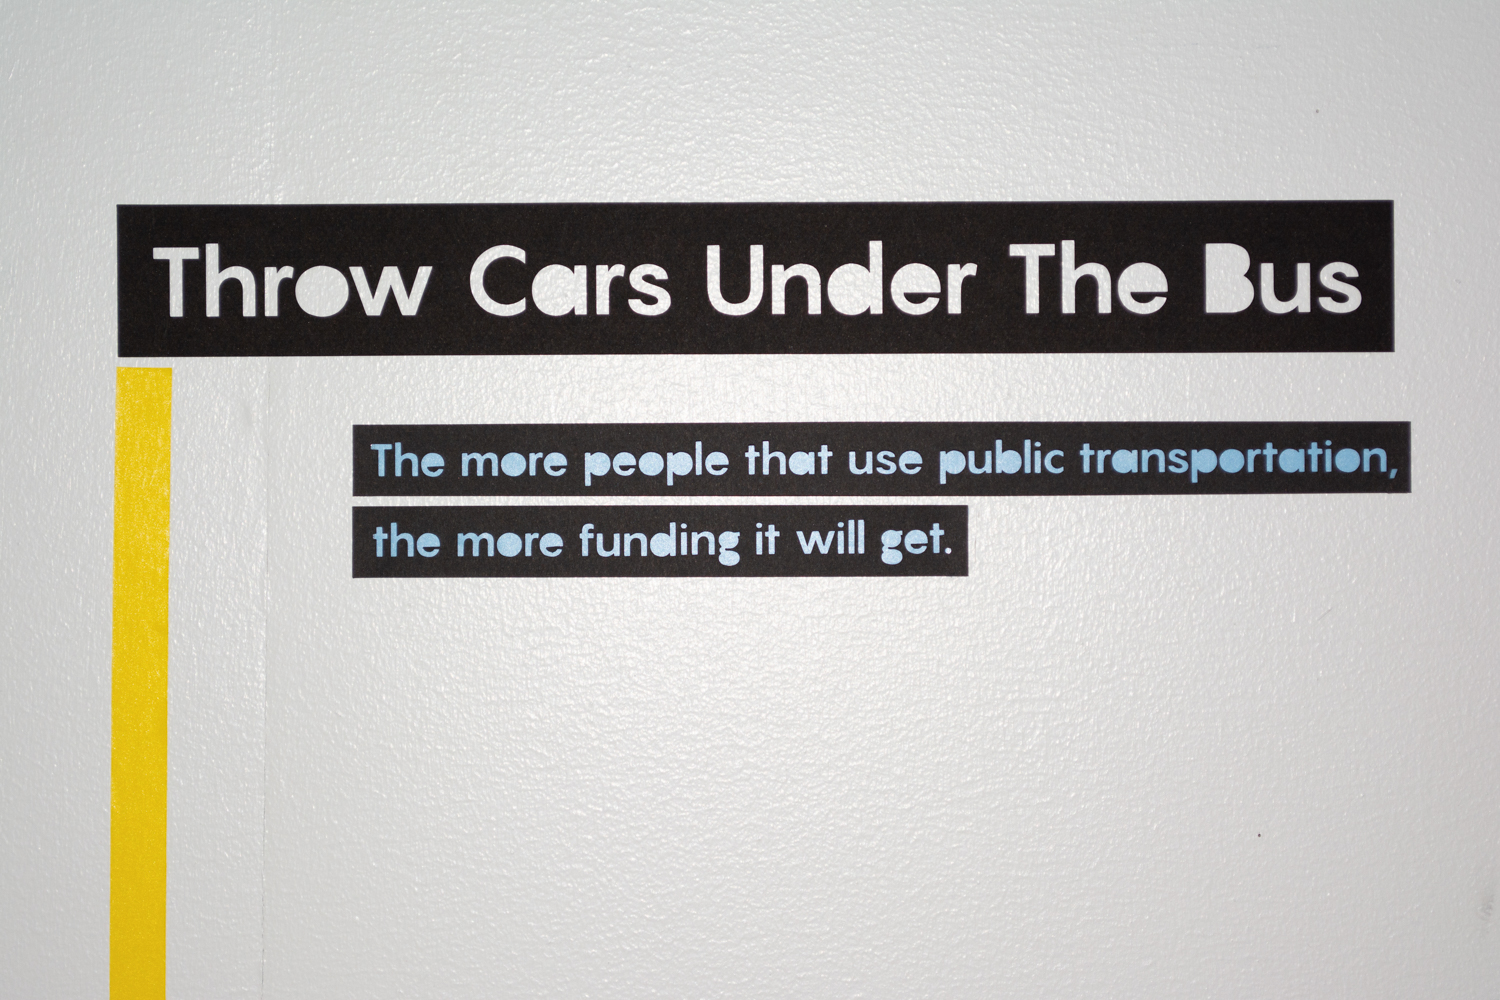
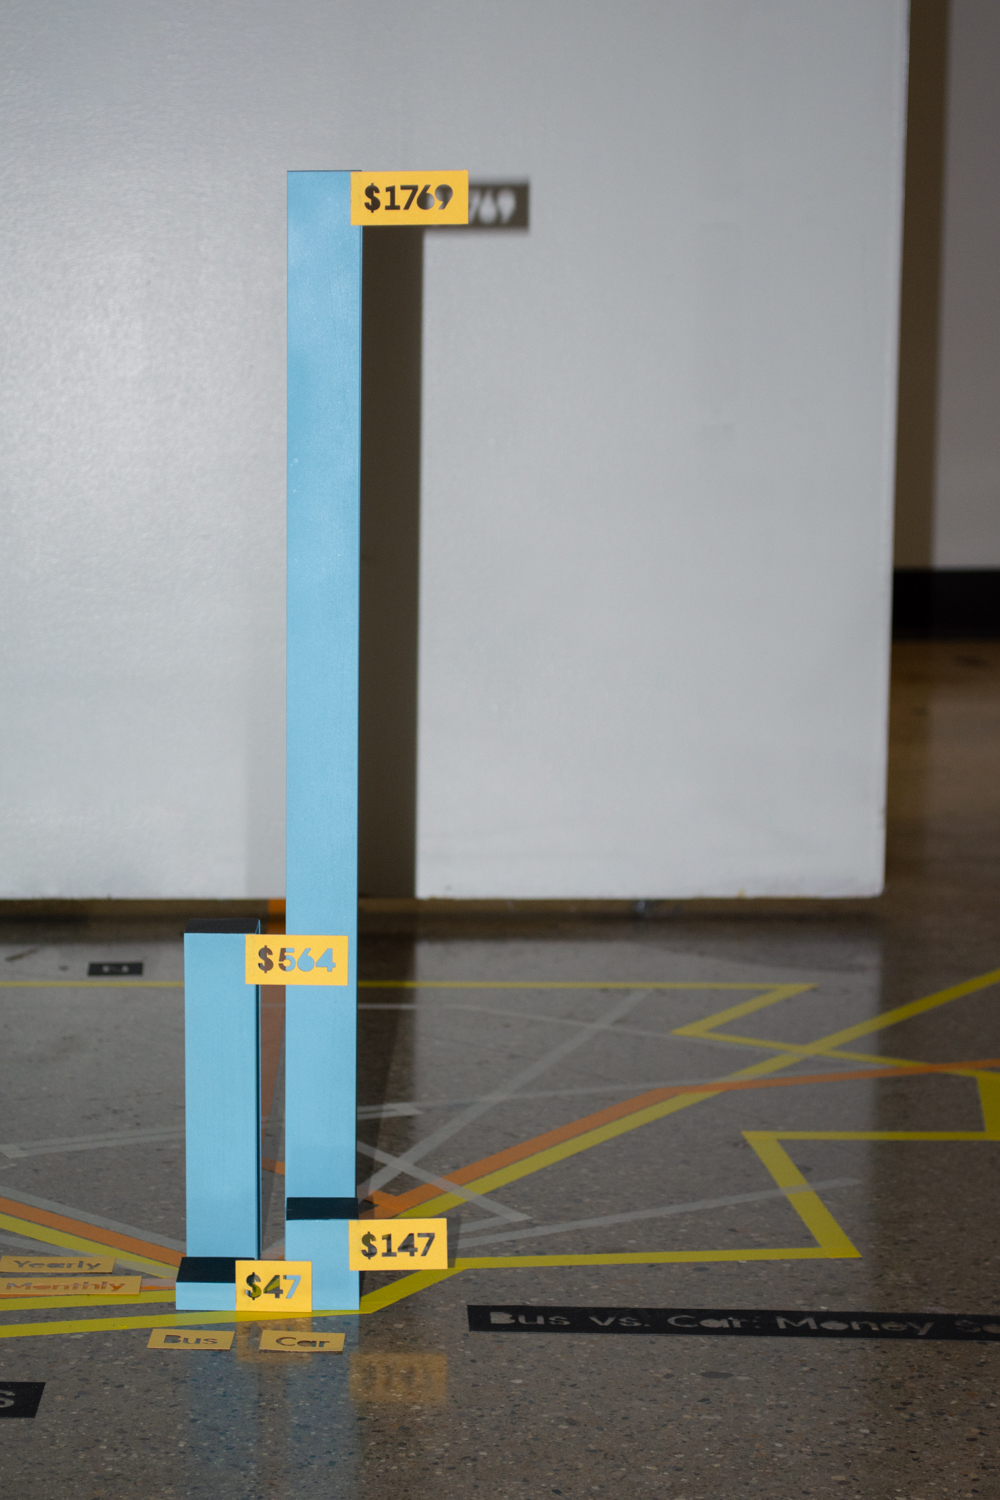
Throw Cars Under the Bus
Data Visualization
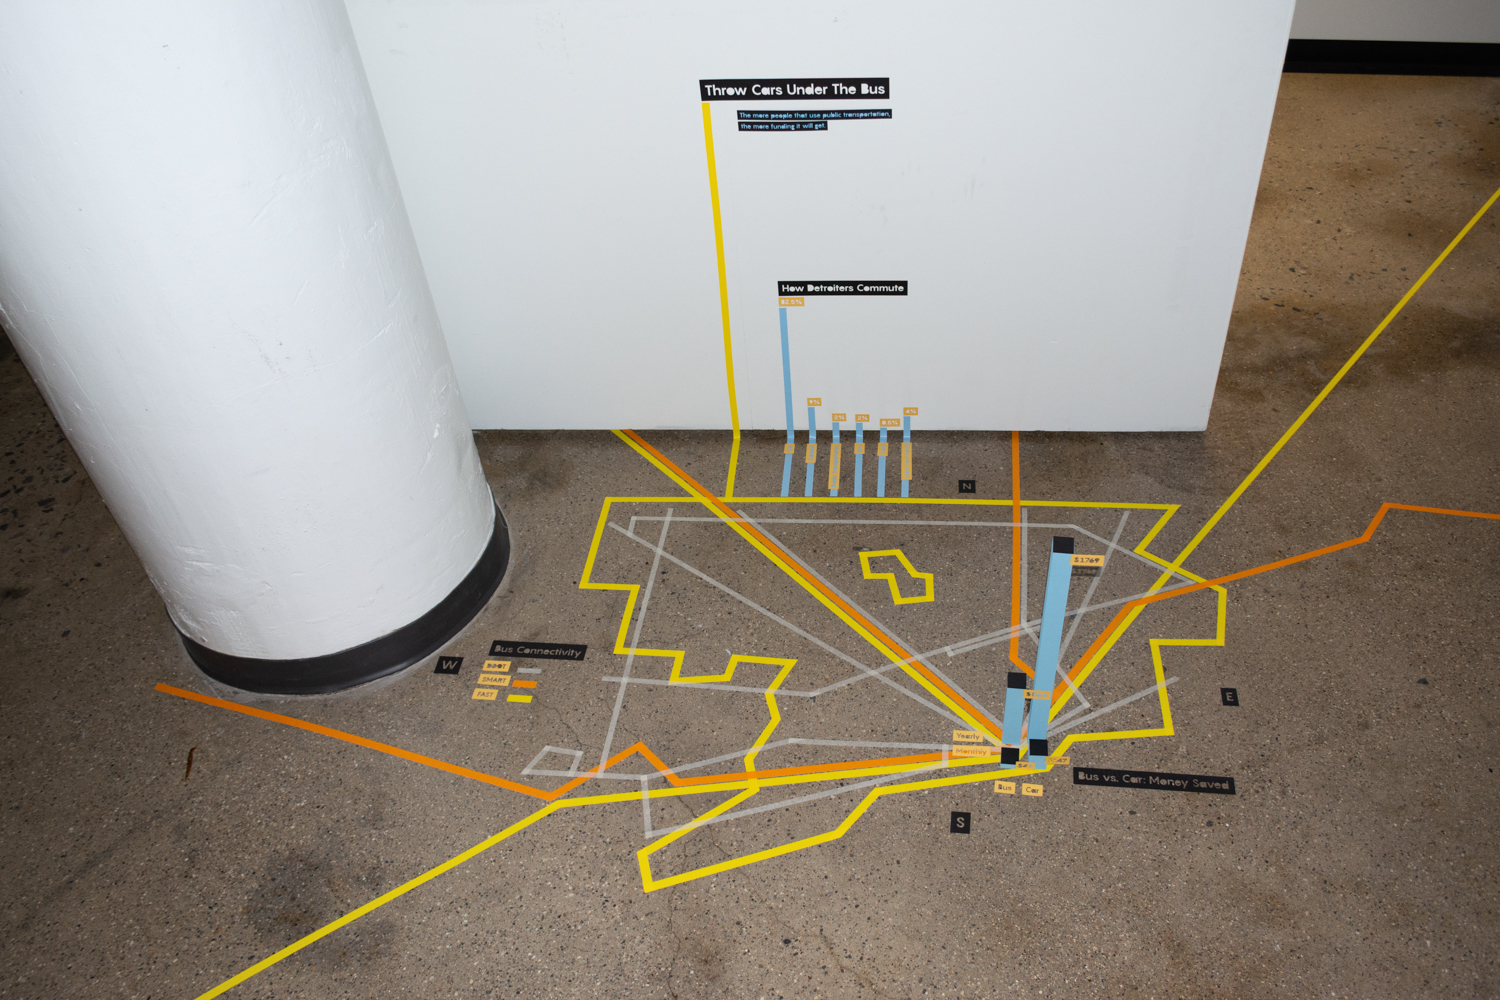
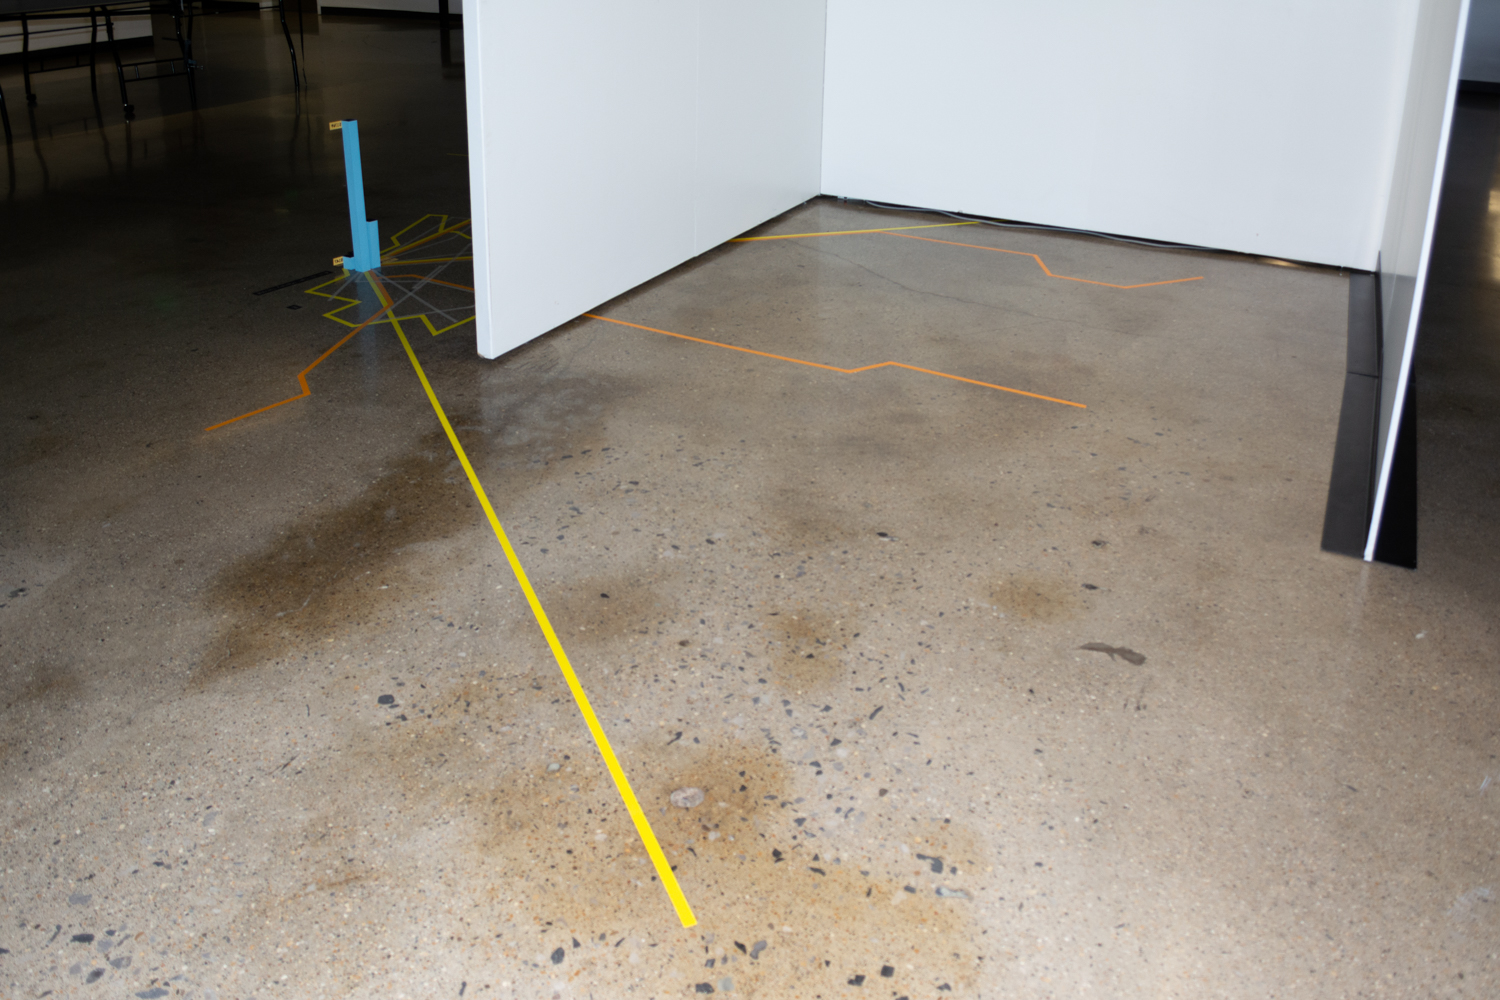
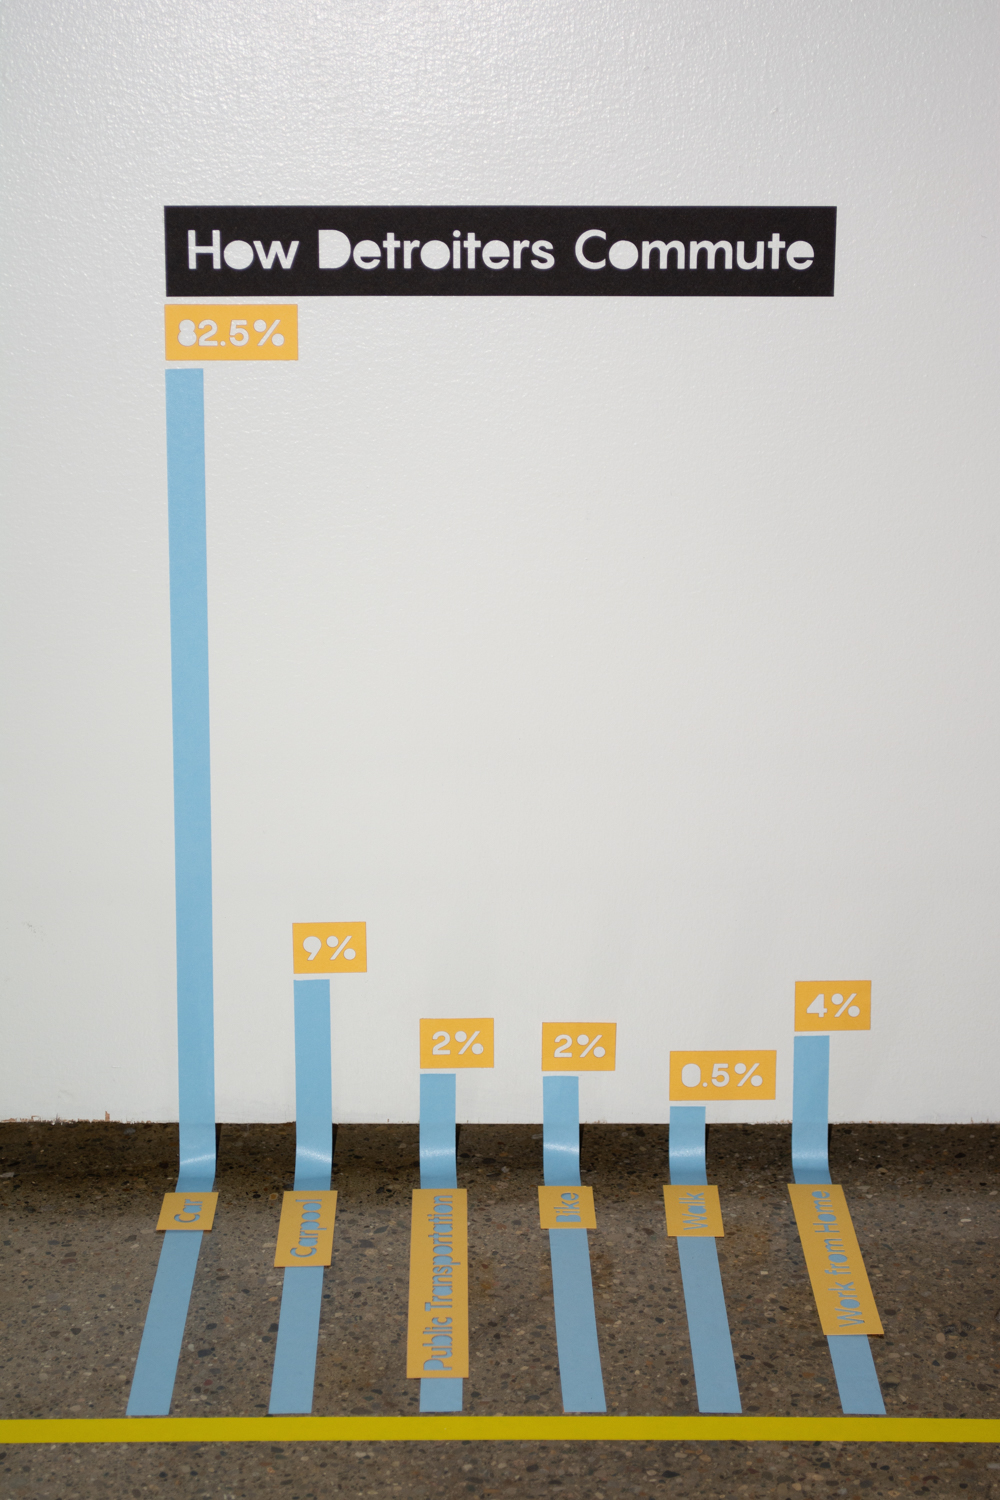
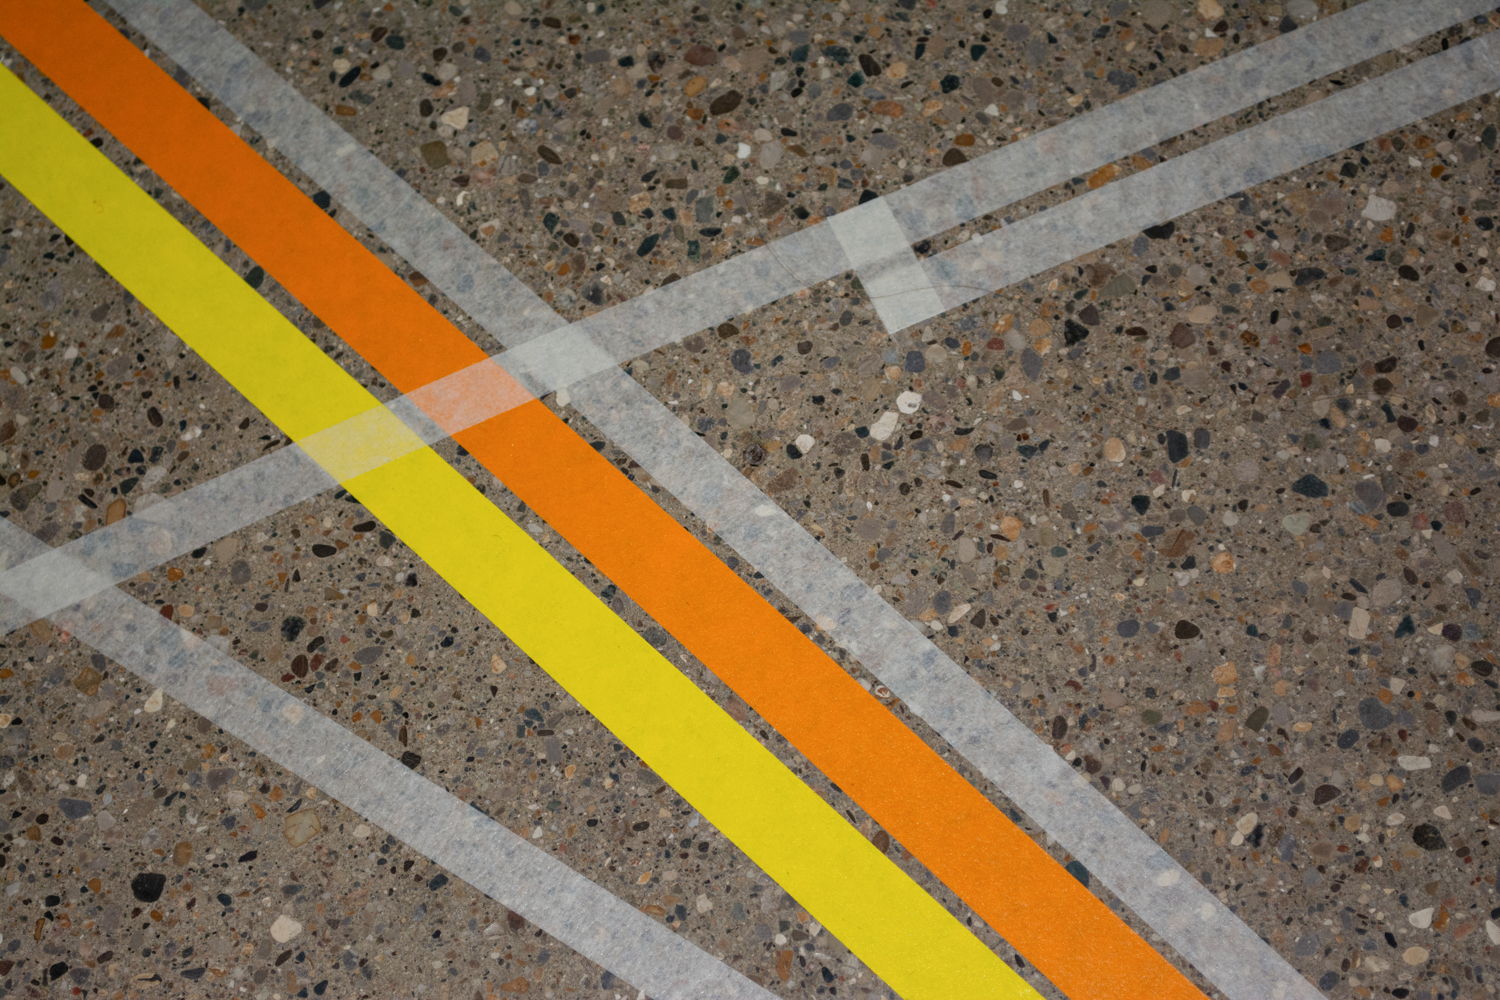
In hopes of changing people's perspective on transportation in Detroit, data was presented in a sprawling physical display to draw in passerbys. Inspiration was drawn from bus transit maps, and a variety of colorful tapes were used to map out the data.

Brief
To take a set of data on Detroit and create a three-dimensional data visualization with a storyline.
Concept
On the subject of transportation in Detroit, and taking inspiration from bus route posters, colored tape was placed all over the floor to create an eye-catching, life sized visualization resembling a city map with graph bars representing buildings downtown. Mapped by hand with a ruler and an x-acto blade as trusty sidekicks.